Building a partnerships dashboard execs trust
How to build a partnerships dashboard executives will actually use. The few numbers they want, sourced vs influenced definitions that hold up, and a layout finance can trace.
Execs do not want a partnerships dashboard. They want four numbers they can defend in a board meeting, with definitions that survive a follow-up from finance. Everything else is diagnostic, and diagnostic belongs in a view the partnerships owner uses, not on the slide that decides whether the program gets funded next quarter.
That is the gap most teams miss. They build a dashboard that answers "what did we do this quarter" and then wonder why the CFO discounts the line. The CFO has been shown a number that cannot be traced, that mixes sourced with influenced, and that changes definition every time the slide is rebuilt. Trust is not a design problem. It is a definitions problem that happens to live on a dashboard. This guide is the exec view. It pairs with partnership metrics, influenced vs sourced pipeline, and the ROI math in partner program ROI.
The 60-second version
- Execs want outcomes, not activity. Sourced pipeline, influenced pipeline, partner-attributed revenue, and one health number. Meetings and partners signed stay off this screen.
- Sourced and influenced must never overlap. Sourced means the partner originated a deal that would not exist otherwise. Influenced means they touched a deal that already did.
- Definitions have to hold up under a follow-up. If finance asks where a figure comes from, the answer is one click to a CRM report, not a footnote only the partnerships lead understands.
- Show the same four tiles every quarter. Changing the metrics to match whichever number looks good is how a dashboard loses credibility.
- Trends beat snapshots. A single quarter can be staged. Four quarters of the same definition cannot.
- Keep an owner view underneath. Activity, coverage, time-to-live, and error rate help you diagnose. They do not belong on the exec slide.
- Tag at entry, not at close. Attribution rebuilt from memory is the fastest way to a number nobody trusts.
- Refresh on a fixed cadence, with named owners. A dashboard without an owner and a date is a screenshot.
Why most partnership dashboards lose the room
The first failure is volume. Asked for a board update, a partnerships lead dumps every number they can collect: partners signed, meetings, MOUs, listings, logos. The slide is full. The question in the room is still "what did this return." Nielsen Norman Group's work on dashboard design makes the same point: a dashboard that tries to show everything shows nothing.
The second failure is mixing buckets. Sourced and influenced get added into one "partner pipeline" figure that looks large and cannot be defended. The moment finance traces a deal that was already in the CRM, the whole line is treated as fiction. That is a classification problem, and it has to be solved before tiles go on the page.
The third failure is a moving definition. Q1 reports sourced as registered deals. Q2 includes anything a partner "helped." Q3 adds untagged marketplace revenue. Leadership is watching a new invention each quarter, not a trend. Google's SRE book on monitoring is blunt: if you change what a signal means, you cannot compare it to last period.
The fix is separation. One screen for execs, four outcomes, same definitions, every time. One screen for the owner, where activity and health live so you can explain why a tile moved.
The four numbers execs actually want
Leadership does not ask how many partner calls you ran. They ask whether partnerships created demand, whether they helped deals you already had, whether any of it closed, and whether the technical work is healthy enough to keep funding.
| Exec question | The number | Where it lives |
|---|---|---|
| Did partners create demand we would not have had? | Sourced pipeline, then sourced revenue | CRM partner-source field, origination flag |
| Did partners help deals we already had? | Influenced pipeline, with win-rate vs unassisted | CRM influence tag, closed-won |
| Did any of it become money? | Partner-attributed revenue (sourced + discounted influenced) | CRM plus billing |
| Is the integration work actually used? | Weekly active connections, or active-to-install ratio | Product analytics |
Four tiles is enough. Sourced pipeline is the demand proof. Influenced pipeline is usually the larger number, capturing co-sell and integration-led wins on deals you were already working, the motion in the co-selling engine guide. Partner-attributed revenue is the close of both stories, counted conservatively so it matches partner program ROI. The health tile is the product check: if pipeline looks fine while active connections are flat, you have a story that will not renew.
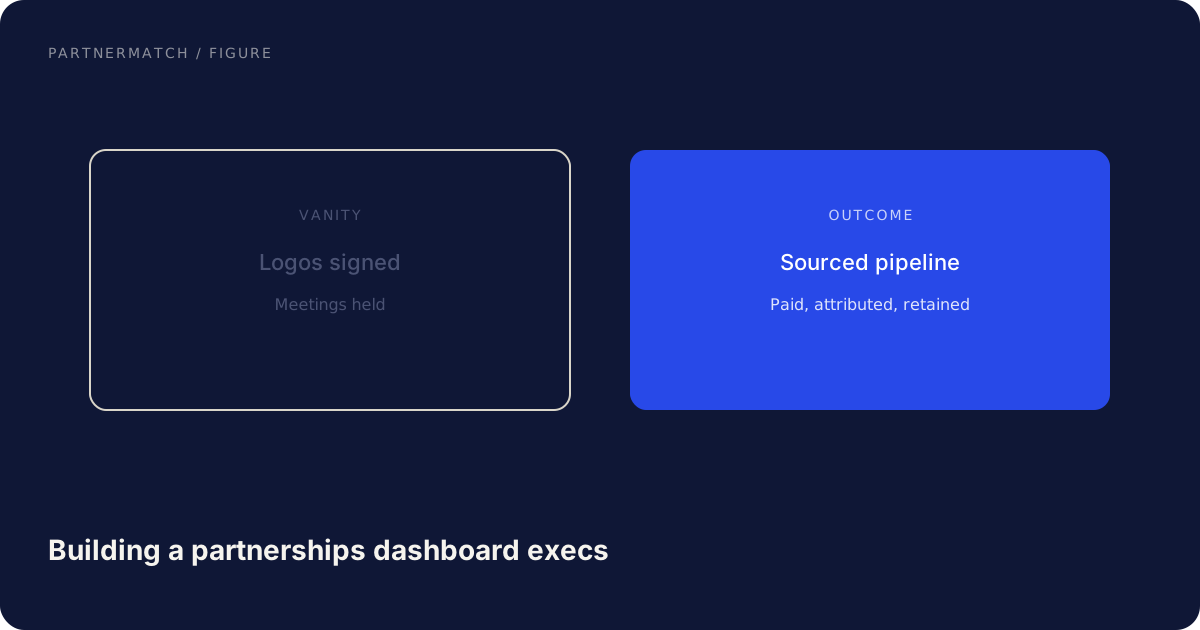
Partners signed, logos, meetings, and MOUs do not belong here. Those can rise while the business stays flat. The longer argument is in partnership metrics. Time to first live is an owner metric by the time you have an exec dashboard.
Sourced vs influenced, written so finance will sign off
Sourced means the partner originated the opportunity. The deal did not exist in your pipeline before they brought it. Full credit, because the counterfactual is clean: no partner, no deal.
Influenced means the partner touched a deal that came from elsewhere. A co-sell where their seller vouched for you. A referral into a deal you were already working. An integration that became the reason the customer chose you. Influence credit, not sole credit.
The test is one question: would this deal exist without the partner? No means sourced. Yes means influenced. The full rules live in influenced vs sourced pipeline. The dashboard's job is to apply them without exception.
| Rule | What it prevents |
|---|---|
| A deal is sourced or influenced, never both | Double counting the same close in two tiles |
| Tag at entry, not at close | Reconstruction from memory after the money lands |
| Origination needs evidence (deal registration or a timestamped intro) | "They helped" being upgraded to sourced |
| Influence needs a specific, dated touch inside the open window | Logo-on-a-slide counting as a touch |
| When unclear, default to influenced | Inflating the cleaner number under pressure |
| Influenced pipeline is reported beside direct revenue, not added on top | Totals that no longer add up |
Influenced pipeline is a view of deals partners touched. It is not a second copy of revenue. If you add influenced ARR on top of company ARR, you have double counted, and the dashboard dies in the first reconciliation. Report the dollars, the win rate versus unassisted deals, and the share of closed-won that carried a partner tag. That is the co-sell attribution discipline applied to a screen.
Definitions that hold up under a follow-up question
A definition is a sentence finance can use to rebuild the number from the CRM. If they cannot, the dashboard is a story.
For each tile, write four things and keep them stable: name (sourced pipeline, not "partner-driven demand"), inclusion rule, exclusion rule, and source system (the saved CRM view, not a private spreadsheet). Do this for influenced, attributed revenue, and the health tile. Put the sentences in an appendix the first two times you show the dashboard.
Also write down pipeline versus revenue, weighted versus unweighted, the period, and currency. If you cannot write the inclusion rule in one sentence, keep it off the exec screen.
One screen, trends, and a drill-down
One screen for execs. Four tiles: sourced pipeline, influenced pipeline, attributed revenue, active connections. Each tile has the current number, the prior period, and a sparkline of the last four quarters. Under the tiles, the top five partners by attributed revenue, so the conversation can go from "the line moved" to "which partner moved it."
Trends, not just levels. A tile that only shows "sourced pipeline is $1.4M" can be a lucky quarter. Direction is the honest part. If you only have two quarters of clean data, show two.
A drill-down, not a second story. When someone clicks sourced pipeline, they should land on the CRM list of those opportunities. Traceability is what SRE monitoring means by a dashboard that points into the system rather than replacing it.
The owner view sits in a separate tab: partners signed, meetings, time to first live, error rate, install-to-active ratio. You need those when an outcome tile stalls, not in the board packet. A partner QBR can filter the same four tiles to one partner. Do not build a second dashboard.
Cadence, owners, and how the number gets into the CRM
Tag at entry, carry to close, refresh on a calendar. The moment a partner enters a deal, set partner-source to sourced or influenced, name the partner, and (for influence) add a touch tag. Reconstructing this at close is how every deal becomes a negotiation. The mechanics are in co-sell attribution.
One owner per tile. Sourced and influenced are owned by partnerships, with sales setting the field. Attributed revenue is owned jointly with finance. Active connections is owned with product analytics.
Weekly, someone looks at opportunities missing a partner-source. Monthly, freeze the numbers you will compare. Quarterly, show the four tiles with four-quarter trends. Export the snapshot from the same views. Do not rebuild the dashboard for the board.
| Tile | Owner | Refresh | Drill-down |
|---|---|---|---|
| Sourced pipeline | Partnerships, field set by sales | Weekly hygiene, monthly freeze | CRM list of sourced opps |
| Influenced pipeline | Partnerships, field set by sales | Weekly hygiene, monthly freeze | CRM list of influenced opps |
| Attributed revenue | Partnerships + finance | Monthly, aligned to close | Closed-won with partner tag |
| Active connections | Partnerships + product | Weekly | Analytics of active vs idle installs |
A CRM field, a saved report, and a product dashboard cover a seed-to-Series-B program. Buy tooling later. Do not hire, the topic of when to hire partnerships, to decorate a dashboard you have not defined. Across the SaaS partnership lifecycle, the tiles stay put. The targets move.
Common mistakes, and the fix
Putting activity on the exec screen because it is easy to collect. The fix: four outcome tiles, same every quarter. If a number can rise while the business stays flat, it does not belong in the board packet.
Adding sourced and influenced into one "partner pipeline" tile. The fix: two tiles, no overlap, influence reported beside direct revenue rather than on top of it.
Changing the definition when the number looks bad. The fix: write the inclusion rules once and live with a modest number. A smaller true figure beats a larger one that finance will unwind.
Reconstructing attribution at close. The fix: tag at entry. Deal registration for sourced, a dated touch for influenced. Memory is not a source system.
Showing a snapshot with no trend, or a second dashboard per audience. The fix: four quarters of the same definition, one source of truth, filtered. Direction is the part leadership can use.
FAQ
What should be on a partnerships dashboard for executives? Four outcome numbers: sourced pipeline, influenced pipeline, partner-attributed revenue, and a health metric such as weekly active connections. Activity counts belong on an owner view, not on the exec screen.
How do you define sourced vs influenced so finance trusts it? Sourced means the partner originated a deal that would not exist without them. Influenced means they touched a deal that already existed. A deal is one or the other, never both. When unclear, default to influenced. Report influenced pipeline beside direct revenue, not added on top of it.
How many metrics should an exec partnerships dashboard show? Four on the exec screen, with a sparkline and a prior-period comparison on each. A small table of the top partners by attributed revenue is the only extra. More tiles hide the four questions leadership actually asks.
Where should the data for a partnerships dashboard come from? Sourced and influenced live in a partner-source field on the CRM opportunity. Attributed revenue is that field carried to closed-won. Active connections live in product analytics. Each tile should drill to its source system in one click.
How often should we refresh a partnerships dashboard? Weekly hygiene on CRM tags, a monthly freeze, and a quarterly exec snapshot from those same views. Do not rebuild the dashboard for the board. Export it.
Do we need partner software to build a dashboard execs trust? No. A CRM field, saved reports, and a product analytics view are enough through Series B. Trust comes from definitions and traceability, not from the tool that draws the tiles.
The short version
A partnerships dashboard execs trust is four numbers, the same every quarter, with definitions finance can rebuild from the CRM. Sourced pipeline for demand the partner created. Influenced pipeline for deals the partner improved, never overlapping sourced, never added on top of company revenue. Partner-attributed revenue for what actually closed, counted conservatively. A health tile, usually weekly active connections, so a pretty pipeline cannot hide an unused integration. Tag at entry, write the inclusion rules once, show trends, and keep activity off the exec screen.
If you want the exec view built from your actual CRM and product data, with sourced and influenced defined so finance will sign off, that is what a Partner Audit is for. We review your metrics, your attribution, and your integration health, then leave you with a four-tile dashboard and the rules behind it.
Further reading
- Dashboard Design: Considerations and Best Practices, Nielsen Norman Group.
- Monitoring Distributed Systems, Google SRE Book.
- Partnership metrics that matter for which KPIs to keep.
- Influenced vs sourced pipeline for the classification rules the tiles depend on.